ESG Data Book
We published the ESG Databook 2023 in September 2023, which summarizes Sanwa Group's environmental, social and governance information.
Environment
| CO2 emissions | ||||||||
| Boundary | Unit | FY2020 | FY2021 | FY2022 | Reference | |||
|---|---|---|---|---|---|---|---|---|
| CO2 Emission(Scope1+Scope2) | A | t-CO2 | NA | 75,500 | 78,773 | Initiatives Towards a Decarbonized Society | ||
| Scope1 | t-CO2 | NA | 40,900 | 32,860 | ||||
| Scope2 | t-CO2 | NA | 34,600 | 45,913 | ||||
| CO2 Emission(Scope1+Scope2) | B | t-CO2 | 22,917 | 22,338★ | 22,307★ | |||
| Scope1 | t-CO2 | 10,468 | 10,439★ | 10,316★ | ||||
| Scope2 | t-CO2 | 12,449 | 11,899★ | 11,992★ | ||||
| CO2 Emissions intensity per M yen of sales ※1 | t-CO2/M yen | 0.11 | 0.11 | 0.10 | ||||
| Scope3※2 | t-CO2 | 11,715 | 11,182 | 303,511 | ||||
| Scope3 Category 1 ※3 | t-CO2 | NA | NA | 286,045★ | ||||
| Scope3 Category 3 ※4 | t-CO2 | NA | NA | 4,807★ | ||||
| Scope3 Category 4 ※5 | t-CO2 | 11,715 | 11,182 | 12,659 | ||||
| Energy consumption | ||||||||
| Boundary | Unit | FY2020 | FY2021 | FY2022 | ||||
| Energy Consumption (Crude Oil equivalent) | B | ㎘ | 8,865 | 8,825 | 9,434 | |||
| Office | ㎘ | 2,150 | 2,101 | 2,066 | ||||
| Energy Consumption intensity per m2 of floor space | Target(㎘/m2) | 0.0237 | 0.0235 | 0.0233 | ||||
| Result(㎘/m2) | 0.0238 | 0.0234 | 0.0224 | |||||
| Factory | ㎘ | 6,687 | 6,724 | 7,368 | ||||
| Energy Consumption intensity per M yen of product shipped | Target (㎘/M Yen) |
0.1146 | 0.1180 | 0.1168 | ||||
| Result (㎘/M Yen) |
0.1192 | 0.1119 | 0.1072 | |||||
| Resources | ||||||||
| Boundary | Unit | FY2020 | FY2021 | FY2022 | Reference | |||
| Raw materials used ※6 | D | Tons | 260,899 | 260,173 | 257,931 | Effective Use of Resources | ||
| Metal raw materials | Tons | 236,580 | 244,613 | 243,675 | ||||
| Coating, Urethane, FRP, others | Tons | 24,319 | 15,560 | 14,256 | ||||
| Class 1D Designated Chemical substance | C | Tons | 509 | 516 | 584 | |||
| Waste | ||||||||
| Boundary | Unit | FY2020 | FY2021 | FY2022 | ||||
| Waste Emissions | B | Tons | 6,944 | 6,408 | 5,738 | |||
| Waste Emissions intensity | kg/M yen | 34.81 | 31.10 | 25.73 | ||||
| Office ※7 | Tons | 4,798 | 4,426 | 3,868 | ||||
| Waste Emissions intensity per M yen of sales |
Target (kg/M yen) |
22.99 | 23.82 | 23.58 | ||||
| Result (kg/M yen) |
24.06 | 21.48 | 17.34 | |||||
| Factory | Tons | 2,145 | 1,982 | 1,870 | ||||
| Waste Emissions intensity per M yen of product shipped |
Target (kg/M yen) |
35.14 | 37.86 | 37.48 | ||||
| Result (kg/M yen) |
38.25 | 32.99 | 27.21 | |||||
| Hazardous waste ※8 | Tons | 73.8 | 93.8 | 101.5 | ||||
| Volume of recycled | C | Tons | 11,208 | 10,558 | 11,505 | |||
| SOx Emissions ※9 | E | Tons | 0.03 | NA | NA | |||
| Water use | ||||||||
| Boundary | Unit | FY2020 | FY2021 | FY2022 | Reference | |||
| Water Used | B | thousand m3 | 122 | 117 | 128 | Effective Use of Resources | ||
| Water Usage intensity | m3/M yen | 0.61 | 0.57 | 0.57 | ||||
| Water intake | C | thousand m3 | 88 | 82 | 96 | |||
| Potable water | thousand m3 | 40 | 36 | 37 | ||||
| Industrial water | thousand m3 | 47 | 46 | 59 | ||||
| Water discharge ※10 | thousand m3 | 39 | 58 | 48 | ||||
| Public water area | thousand m3 | 38 | 56 | 47 | ||||
| sewerage | thousand m3 | 1 | 2 | 1 | ||||
| Ratio of Production Sites by Water-stressed ※11 |
D | % | 6.3 | 14.1 | 14.1 | |||
| Amount of water intake in Water-stressed sites | thousand m3 | 41.8 | 34.5 | 24.0 | ||||
| ISO14001 | ||||||||
| Boundary | Unit | FY2020 | FY2021 | FY2022 | Reference | |||
| ISO14001 Certificated rate | C | % | 100 | 100 | 100 | Environmental Management | ||
| Environmental law violations ※12 | ||||||||
| Boundary | Unit | FY2020 | FY2021 | FY2022 | Reference | |||
| No. of environmental law violations (incl.water) | D | Issues | 0 | 0 | 0 | Environmental Management | ||
| Total Cost of Environmental Fines and Penalties | Millions of Yen | 0 | 0 | 0 | ||||
※The Japan Management Association GHG Certification Center (JMACC) has provided third-party verification of the values for Sanwa Shutter Corporation’s CO2 emissions(Scope1+Scope2) for fiscal 2021-2022 and Scope3(Category 1+3) for fiscal 2022. Figures that were subject to third-party verification are indicated with a star (★).
(Note) Boundary
A… Sanwa Group (Consolidated)
*Starting from FY2022, figures are for the consolidated Sanwa Group. Figures for FY2021 are for the consolidated Sanwa Group excluding Asia.
B … Sanwa Shutter Corporation
C … Sanwa Shutter Corporation (Factories)
D … Sanwa Group (Consolidated)
E … Sanwa Shutter Corporation (Ota Door Factory)
※1: CO2 Emission (Scope1+Scope2)/Sales (¥ million)
※2:Starting from FY2022, figures are the total values for Scope 3 Categories 1, 3, and 4.
※3:Emissions for Scope 3 Category 1 (purchased goods and services) are calculated by multiplying the purchased weights of Sanwa Shutter Corporation’s main raw materials-steel, aluminum, and stainless steel—by the emission factors from the National Institute of Advanced Industrial Science and Technology (AIST) IDEA ver. 2.3 database.
※4:Emissions for Scope 3 Category 3 (fuel and energy related activities not included in Scopes 1 or 2) are calculated by multiplying the emission factors specified by the Ministry of the Environment with the aggregated energy consumption in Scopes 1 and 2.
※5:Emissions for Scope 3 Category 4 (upstream transportation and distribution) are calculated by multiplying the emission factors specified by the Ministry of the Environment with the fuel consumption of trucks related to the transportation of goods (factories to sales offices) which Sanwa Shutter was identified as the consigner.
※6: Starting from FY2021, figures are for the consolidated Sanwa Group.
※7: Industrial waste only
※8: Hazardous waste=Specially controlled industrial waste
※9: Calculated from two boilers at Ota door factory
※10: Including estimated figure
※11: Ratio of production sites which are classified as"Extremely High"and"High" using the Aqueduct Water Risk Data disclosed by Aqueduct (World Resources Institute: WRI).
※12: Significant violations with fines of 1 million yen or more
Social
| Diversity | ||||||||
| Boundary | Unit | FY2020 | FY2021 | FY2022 | Reference | |||
|---|---|---|---|---|---|---|---|---|
| No.of employees (consolidated) | A | Persons | 11,540 | 12,785 | 12,773 | Promotion of Diversity | ||
| By Region | Japan | Persons | 4,190 | 4,274 | 4,300 | |||
| USA(ODC) | Persons | 3,744 | 4,821 | 4,797 | ||||
| Europe(Novoferm Group) | Persons | 3,092 | 3,215 | 3,247 | ||||
| Asia | Persons | 514 | 475 | 429 | ||||
| Rate of female employees (consolidated) | % | 17.9 | 18.8 | 19.8 | ||||
| Rate of female employees in managerial position (consolidated) | % | 11.2 | 13.7 | 13.9 | ||||
| Rate of employees with disabilities (consolidated) | % | 3.5 | 3.6 | 2.8 | ||||
| Full-time staff turnover rate (consolidated) ※1 | % | 9.4 | 14.7 | 13.5 | ||||
| Rate of temporary staff in the workforce (consolidated) | % | 13.0 | 12.6 | 13.5 | ||||
| Employees | ||||||||
| Boundary | Unit | FY2020 | FY2021 | FY2022 | Reference | |||
| No. of employees | B | Persons | 3,010 | 3,054 | 3,057 | Work-Life Balance | ||
| Of which, Male | Persons | 2,743 | 2,751 | 2,725 | ||||
| Of which, Female | Persons | 267 | 303 | 332 | ||||
| Average age | Years old | 41.1 | 41.1 | 41.1 | ||||
| Average tenure | Years | 16.0 | 16.0 | 15.8 | ||||
| Average annual salary | Ten thousand of Yen |
697 | 701 | 704 | ||||
| Average of taking annual paid leaves ※2 | Days | 7.7 | 8.5 | 9.1 | ||||
| Rate of taking annual paid leaves | % | 43.1 | 47.7 | 50.6 | ||||
| No. of annual holidays | Days | 126 | 127 | 125 | ||||
| Full-time staff turnover rate ※1 | % | 2.0 | 3.0 | 3.2 | ||||
| No. of employees shortened working hours for Childcare | Persons | 22 | 26 | 30 | ||||
| No. of employees taking Childcare leave | Persons | 20 | 21 | 34 | ||||
| Return rate of employees from Childcare leave | % | 90.0 | 100 | 100 | ||||
| Rate of male employees taking Childcare leave | % | NA | 5.4 | 17.3 | ||||
| No. of employees using re-employment system | Persons | 71 | 63 | 79 | ||||
| Mid-career recruitment ratio | C | % | 63.8 | 58.5 | 58.8 | |||
| B | % | 59.6 | 57.5 | 54.5 | ||||
| Gender pay gap ※3 | B | % | NA | NA | 54.0 | |||
| Full time worker | % | NA | NA | 59.6 | ||||
| Part time worker | % | NA | NA | 60.0 | ||||
| Gender pay gap ※3 | F | % | NA | NA | 65.9 | |||
| Full time worker | % | NA | NA | 65.8 | ||||
| Part time worker | % | NA | NA | 58.9 | ||||
| Recruitment | ||||||||
| Boundary | Unit | FY2020 | FY2021 | FY2022 | Reference | |||
| No. of new graduate recruitment | B | Persons | 93 | 96 | 120 |
Promotion of Diversity Human Resource Development |
||
| Of which, Male | Persons | 75 | 77 | 94 | ||||
| Of which, Female | Persons | 18 | 19 | 26 | ||||
| Of which, Students from overseas | Persons | 1 | 1 | 0 | ||||
| background By Academic |
University Graduates (incl.graduate school) |
Persons | 52 | 67 | 72 | |||
| Junior College/Techinical College Graduates | Persons | 3 | 0 | 15 | ||||
| High School Graduates | Persons | 38 | 29 | 33 | ||||
| Retention rate of new University graduates (3 years after employment) |
% | 94.3 | 92.7 | 86.5 | ||||
| Training & Development | ||||||||
| Boundary | Unit | FY2020 | FY2021 | FY2022 | Reference | |||
| No. of employees participating in training hosted by HR development dept. | B | Persons | 837 | 916 | 1,182 |
Human Resource Development Improvement of Customer Satisfaction |
||
| Training participation performance | Participants ×hours |
72,920 | 65,395 | 81,367 | ||||
| Annual training hours per employee | Hours | 24.23 | 21.41 | 26.62 | ||||
| No. of participants of "training by managerial level" | Persons | 712 | 798 | 944 | ||||
| follow-up training (2 and 3 years after joined) | Persons | 103 | 123 | 108 | ||||
| mid-career new employee's trainig | Persons | 95 | 152 | 171 | ||||
| Mentor training | Persons | 34 | 32 | 37 | ||||
| No. of participants of "training by subject" | Persons | 125 | 118 | 238 | ||||
| Sanwa Management Training School | Persons | 18 | 14 | 17 | ||||
| business etiquette training | Persons | - | 19 | 11 | ||||
| global trainees (USA subsidiary) | Persons | - | - | - | ||||
| E-leaning training (ENG) | Persons | - | 78 | 169 | ||||
| No. of correspondence education's participants | Persons | 720 | 737 | 693 | ||||
| No. of participants in training hosted by Installation Training Center | Persons | 1,401 | 2,371 | 2,823 | ||||
| No. of participants in training hosted by Maintenance Training Center | Persons | 534 | 265 | 395 | ||||
| Health&Safety | ||||||||
| Boundary | Unit | FY2020 | FY2021 | FY2022 | Reference | |||
| Lost-time injuries frequency rate (Employees+Contractors) ※4 | D | % | 1.3 | 2.1 | 1.1 | Occupational Health and Safety | ||
| E | % | 1.5 | 2.3 | 1.3 | ||||
| Average of Japanese manufacturing industry | - | % | 1.21 | 1.31 | 1.25 | |||
| Lost-time injuries severity rate (Employees+Contractors) ※5 | D | % | 0.03 | 0.02 | 0.05 | |||
| E | % | 0.04 | 0.02 | 0.07 | ||||
| Average of Japanese manufacturing industry | - | % | 0.07 | 0.06 | 0.08 | |||
| Fatalities due to accidents at work (Employees) | E | Persons | 0 | 0 | 0 | |||
| Fatalities due to accidents at work (Contractors) | Persons | 0 | 0 | 0 | ||||
| No. of participants in training about health & safety standards | Persons | 652 | 407 | 367 | ||||
| Induction program | Persons | 263 | 122 | 113 | ||||
| Risk prediction program | Persons | - | 217 | 127 | ||||
| Overweight rate (BMI 25 and above) | C | % | NA | 35.7 | 34.1 | |||
| Smoking rate | % | NA | 30.2 | 29.8 | ||||
| Complete checkup (incl.re-examination) rate | B | % | NA | 29.2 | 26.7 | |||
| Quality Control | ||||||||
| Boundary | Unit | FY2020 | FY2021 | FY2022 | Reference | |||
| No. of qualified inspectors of fire prevention equipment ※6 | B | Persons | 2,233 | 2,191 | 2,139 | Quality Assurance and Enhancement | ||
| ISO9001 Certificated rate | E | % | 100 | 100 | 100 | |||
| Regional Contribution/Social Contribution | ||||||||
| Boundary | Unit | FY2020 | FY2021 | FY2022 | Reference | |||
| No. of employees joining Sanwa Group Social Contribution Club | C | Persons | 1,192 | 1,151 | 1,106 | Coexistence with Local Communities / Social Contribution | ||
| No. of charitable foundation donated from Sanwa Group Social Contribution Club | foundations | 10 | 10 | 12 | ||||
| Amount for donation from Sanwa Group Social Contribution Club | Millions of Yen | 5.4 | 5.5 | 5.6 | ||||
| No. of participants in volunteer activities ※7 | Persons | 5 | 5 | 5 | ||||
| Respect for Human Rights | ||||||||
| Boundary | Unit | FY2020 | FY2021 | FY2022 | Reference | |||
| Issues related to the infringement of human rights ※8 | A | Issues | 0 | 0 | 0 | Respect for Human Rights | ||
(Note) Boundary
A… Sanwa Group (Consolidated)
B … Sanwa Shutter Corporation
C … Group Companies in Japan
D … Group Companies in Japan (Factories)
E … Sanwa Shutter Corporation (Factories)
F … Suzuki Shutter Corporation
※1: Full time staff voluntary turnover rates.Including early retirees, excluding retirement age person
※2: Excluding summer holidays, New Year holidays and special holidays
※3:The gender pay gap is illustrated by the percentage difference of women’s wages to men’s wages, expressed as 100% for men. The gap is due to differences in the average tenure, the rate of managerial position or the amount of overtime etc., but not to the system.
※4: (Number of lost-time injuries/Total working hours) x 1,000,000.
※5: (Total number of working days lost/Total working hours) x 1,000.
※6: Including contractors
※7: Including local cleanup activity
※8: The number of serious cases related to human rights violation issues are counted.
Governance
| Corporate Governance Structure | ||||||||
| Boundary | Unit | FY2021 | FY2022 | FY2023 | Reference | |||
|---|---|---|---|---|---|---|---|---|
| Board of Directors | Directors | A | Persons | 9 | 10 | 10 | Corporate Governance | |
| Of which, Outside Directors | Persons | 3 | 4 | 4 | ||||
| Of which, Female | Persons | 0 | 1 | 1 | ||||
| No. of times Board of Directors’ meetings are held | Times | 8 | 8 | - | ||||
| Attendance rate at Board of Directors’meetings | % | 98.6 | 100 | - | ||||
| Of which,Outside Directors | % | 95.8 | 100 | - | ||||
| Audit & Supervisory Committee | Audit & Supervisory Committee Members | Persons | 3 | 3 | 3 | |||
| Of which, Outside Directors | Persons | 2 | 2 | 2 | ||||
| Of which, Female | Persons | 0 | 0 | 0 | ||||
| No. of times Audit & Supervisory Committee Members’s meetings are held | Times | 9 | 9 | - | ||||
| Attendance rate at Audit & Supervisory Committee Members’s meetings | % | 100 | 100 | - | ||||
| Of which,Outside Directors | % | 100 | 100 | - | ||||
| Nomination & Compensation Committee | Nomination & Compensation Committee Members | Persons | 5 | 5 | 5 | |||
| Of which, Outside Directors | Persons | 3 | 3 | 3 | ||||
| Of which, Female | Persons | 0 | 0 | 0 | ||||
| No. of times Nomination & Compensation Committee Members’s meetings are held | Times | 2 | 2 | - | ||||
| Attendance rate at Nomination & Compensation Committee Members’s meetings | % | 100 | 100 | - | ||||
| Of which, Outside Directors | % | 100 | 100 | - | ||||
| Exercise rate of voting rights at General Meeting of Shareholders | % | 89.88 | 90.36 | 90.05 | ||||
| Compensation of Directors (FY2022) | ||||||||
| Classification | Total Compensation (M yen) |
classified total compensation (Millions of Yen) |
Number of Officer Eligible (Person) |
Reference | ||||
|---|---|---|---|---|---|---|---|---|
| Base Compensation |
Performance-linked Compensation |
Non-Monetary Compensation, etc. | ||||||
| Directors (excl. Audit & Supervisory Committee members and outside directors) | 352 | 146 | 157 | 49 | 5 | Corporate Governance | ||
| Directors serving as Audit & Supervisory Committee members (excl. outside directors) | 36 | 36 | - | - | 1 | |||
| Outside directors (excl. Audit & Supervisory Committee members) | 19 | 19 | - | - | 2 | |||
| Outside directors (Audit & Supervisory Committee members) | 46 | 46 | - | - | 2 | |||
| Compliance | ||||||||
| Boundary | Unit | FY2020 | FY2021 | FY2022 | Reference | |||
|---|---|---|---|---|---|---|---|---|
| No. of whistleblower issues | B | Issues | 107 | 84 | 81 |
Compliance Respect for Human Rights Fair Operating Practices |
||
| C | Issues | 58 | 36 | 38 | ||||
| No. of participants in compliance training | Persons | 672 | 920 | 818 | ||||
| Of which, No. of participants in antitrust law training | Persons | 205 | 208 | 202 | ||||
| Stakeholder Dialogue | ||||||||
| Boundary | Unit | FY2020 | FY2021 | FY2022 | Reference | |||
| No. of stakeholder dialogue events | A | Times | 187 | 154 | 192 | Stakeholder Dialogue | ||
| One-on-one meetings for institutional investor | Times | 168 | 146 | 174 | ||||
| One-on-one meetings in domestic conference | Times | 11 | 5 | 12 | ||||
| Briefings for individual investor | Times | 2 | 1 | 2 | ||||
| IR overseas roadshows | Times | 5 | 0 | 0 | ||||
| Factory tours for institutional investors | Times | 0 | 1 | 0 | ||||
| ESG Briefing for institutional investors | Times | 1 | 1 | 2 | ||||
| Anti-corruption | ||||||||
| Boundary | Unit | FY2020 | FY2021 | FY2022 | Reference | |||
| No. of Penalties for Corruption | B | Issues | 0 | 0 | 0 | Fair Operating Practices | ||
| Total amount of fines for Corruption | Millions of Yen | 0 | 0 | 0 | ||||
| Tax Transparency | ||||||||
| Boundary | Unit | FY2020 | FY2021 | FY2022 | ||||
| Payments of corporation tax ※1 | B | 100Millions of Yen | 100.64 | 114.75 | 186.15 | |||
| Domestic | 100Millions of Yen | 74.11 | 85.98 | 91.40 | ||||
| Overseas | 100Millions of Yen | 26.53 | 28.77 | 94.74 | ||||
| Total amount of political contributions | D | Millions of Yen | 2 | 2 | 2 | |||
(Note) Boundary
A… Sanwa Holdings Corporation
B … Sanwa Group (Consolidated)
C … Group Companies in Japan
D … Sanwa Shutter Corporation
Third-Party Verification
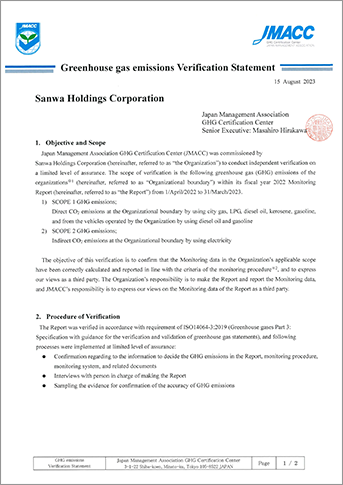
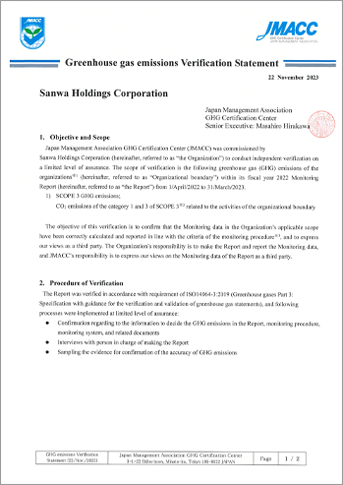
The Japan Management Association GHG Certification Center (JMACC) has provided third-party verification of values for Sanwa Shutter Corporation’s CO2 emissions(Scope1+Scope2) and Scope3(Category 1+3) for fiscal 2022 to ensure their transparency and accuracy. Going forward, we will continue to make effective use of third-party verifications and work to increase the accuracy of our emission calculations.